eCommerce analytics is the process by which businesses gather data from their online stores and analyze its significance. This analytical data assists eCommerce businesses in understanding customer behavior and where they are in the purchasing process. It also tells them what to alter or where to focus their efforts to increase revenue and client conversion.
If you operate an eCom business, eCommerce dashboards help you keep track of your analytics and business operations. Yes, dashboards can be quite useful for providing you with information about your business, but there are so many possibilities that it can take time to select the ideal one.
This article will examine what eCommerce dashboards can accomplish for you and provide a list of factors to consider while selecting one. Let’s get started.
What is an eCommerce dashboard?
An eCommerce dashboard allows you to monitor and manage your online sales from a central location. This can include inventory management, order entry, parcel tracking, and payment processing software.
An eCommerce dashboard provides information on sales…
Your operational performance…
Its primary objective is to facilitate quicker decision-making without requiring excessive effort to comprehend facts. No longer do reports require hours to complete.
Now? In five minutes, you may have an eCommerce dashboard with all your data that you can customize.
Do you need an eCommerce dashboard?
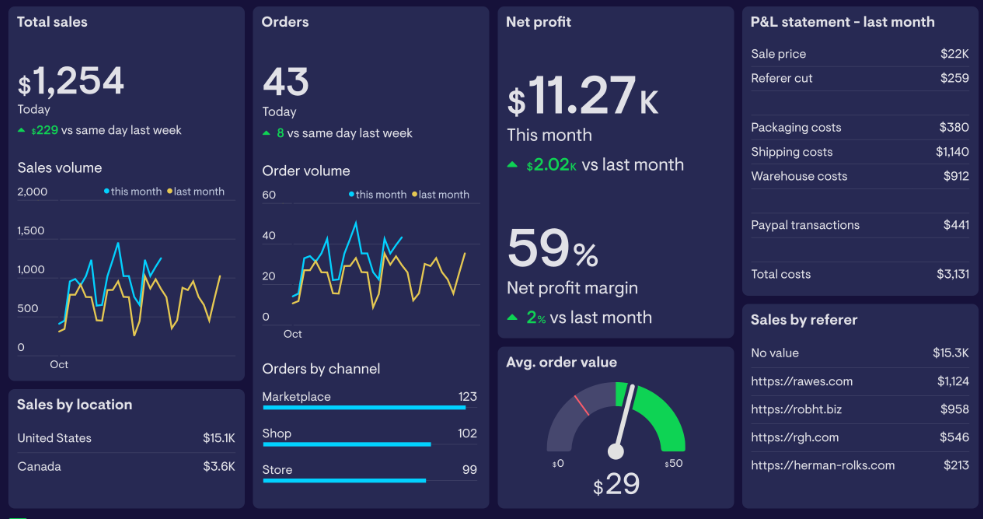
Screenshot from this source
eCommerce dashboards, such as those generated by Google Analytics, differ from other methods of displaying eCommerce analytics, such as reports. They are significantly less complex in terms of how they function and the information they provide, but this makes them more valuable.
Dashboards provide the optimal quantity of information for your eCommerce.
However, only some people are aware that they can also be utilized to:
1. Influence behavior
Productive results can be encouraging. If you show wins in a dashboard, this will encourage your team to work harder and beat your previous bests, especially if you display information such as how far a target has been achieved.
2. Increase overall productivity
Key performance indicators (KPIs) that can be utilized to inspire the entire team can also be measured. A decent dashboard can also serve as an incentive to increase overall productivity.
3. Promotes a data-driven culture
An eCommerce dashboard can also facilitate data retrieval and save substantial time. Your team will be acting on actual data and this can significantly boost your business. Plus, significant errors or problems are swiftly identified and resolved.
Dashboards can provide a variety of information, including:
- Market share
Understand and grow via market share intelligence. Track how your brand fares against the competitors by tracking price trends, discounting trends, estimated units sold, estimated revenue, review growth trends, inventory trends, and share of search. - Site traffic
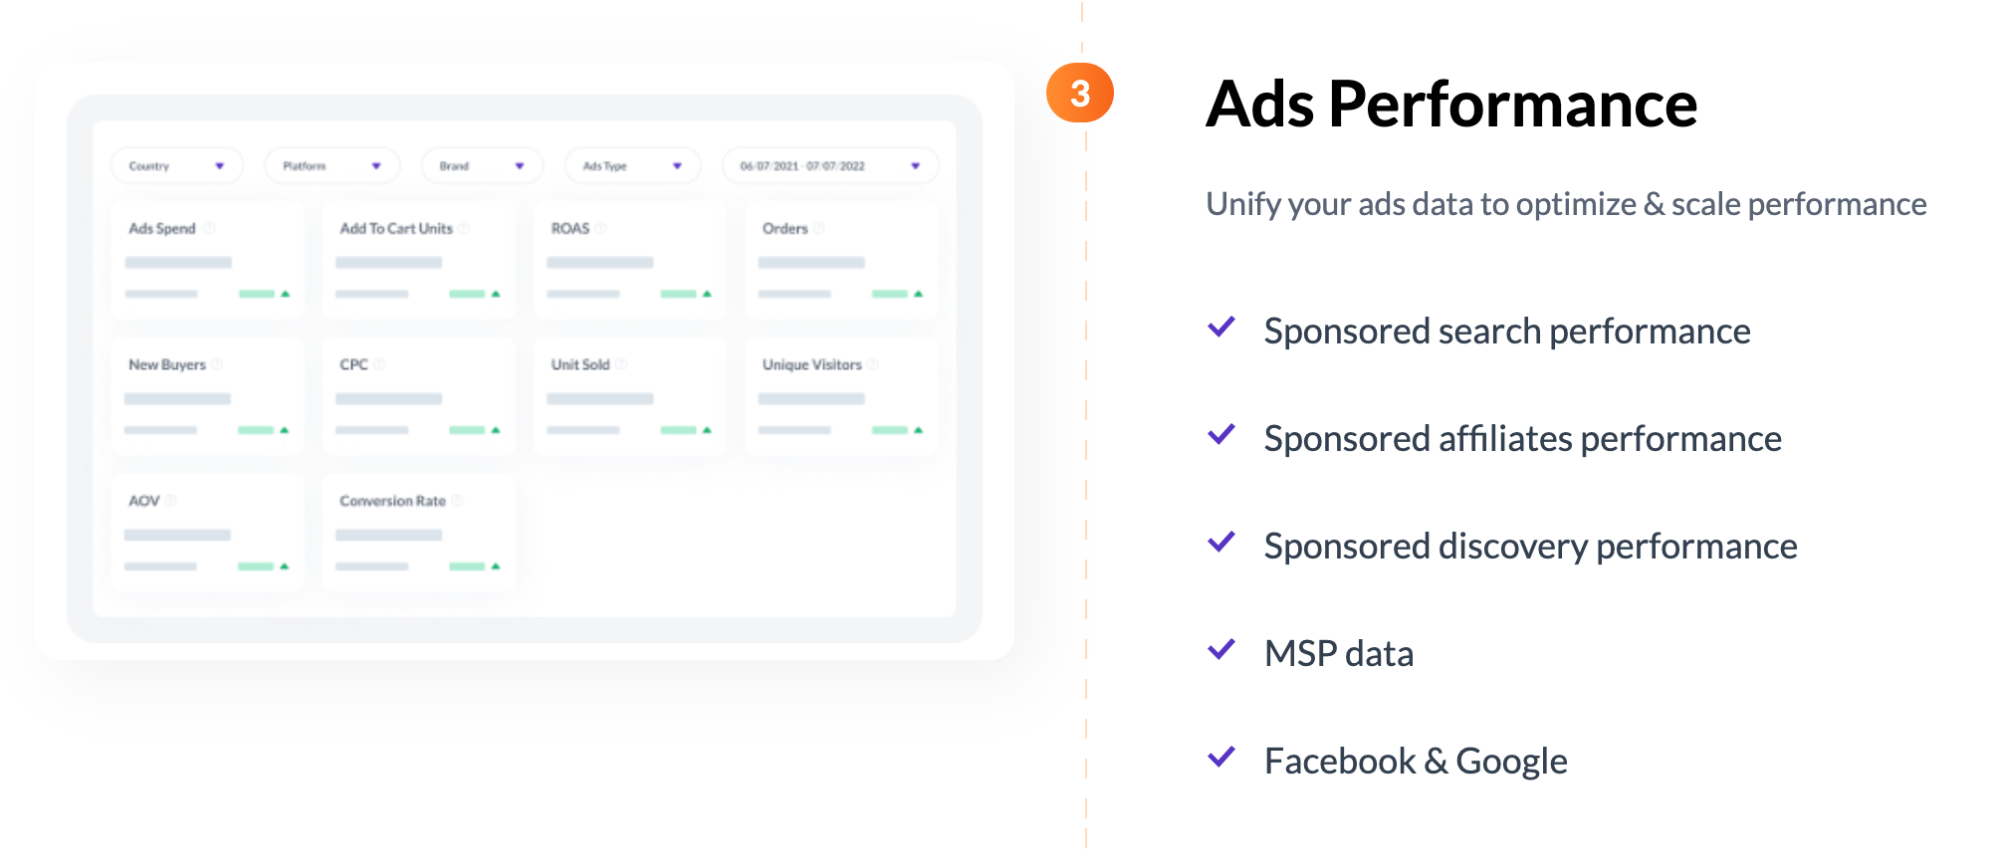
Changes to Google’s algorithms or faults with your website’s design could also contribute to a decline in visitors. It is essential to investigate any traffic decreases to determine what is wrong and rectify it. - Ads performance
eCommerce dashboards tell you if your ads are bringing in sales or not. You can track sponsored search performance, sponsored affiliates performance, sponsored discovery performance, and MSP data. - SEO & CRO Performance
Win share of the shelf with data-driven reporting & processes with category keyword research, organic search visitors, conversion rate, and search rank monitoring. - Easier communication
Clear and concise data visualizations on your dashboard make it easier to explain your findings, increasing the likelihood that stakeholders will agree with you. - Cart abandonment
If many customers place items in their shopping carts but still need to complete the transaction, this may indicate a problem with your checkout process. The process may be too lengthy or difficult to comprehend, or there are insufficient payment options. Regardless of the issue, it is essential to determine why clients abandon their shopping carts and take appropriate action.
Choosing the right eCommerce dashboard
No universal eCommerce dashboard is a one-stop solution for eCommerce websites.
The optimal dashboard for your business will rely on various factors, including the size of your company, the products you sell, and your requirements.
Before making a decision, consider the following factors:
1. The Features
Determine what is most important to your business as a first step. Do you require an eCommerce dashboard that can monitor your inventory levels? Are you searching for a more effective method to comprehend the knowledge about your customers? Once you have determined your requirements, you can filter down your options until you discover a dashboard that suits them precisely.
2. Budget
Your budget is another essential factor to consider. There is a wide range of prices for eCommerce dashboards, so it is essential to select one that meets your budget. Remember that dashboards that cost more typically offer more functionality and customization options.
3. Technology proficiency
Your level of technical expertise is a further consideration. If you are still getting familiar with complex software, you should select an eCommerce dashboard that is simple to use and configure. Conversely, if you know how to code and construct websites, you may have access to more advanced capabilities.
Considering these factors, you may locate the ideal eCommerce dashboard for your company.
What should you include in an eCommerce dashboard?
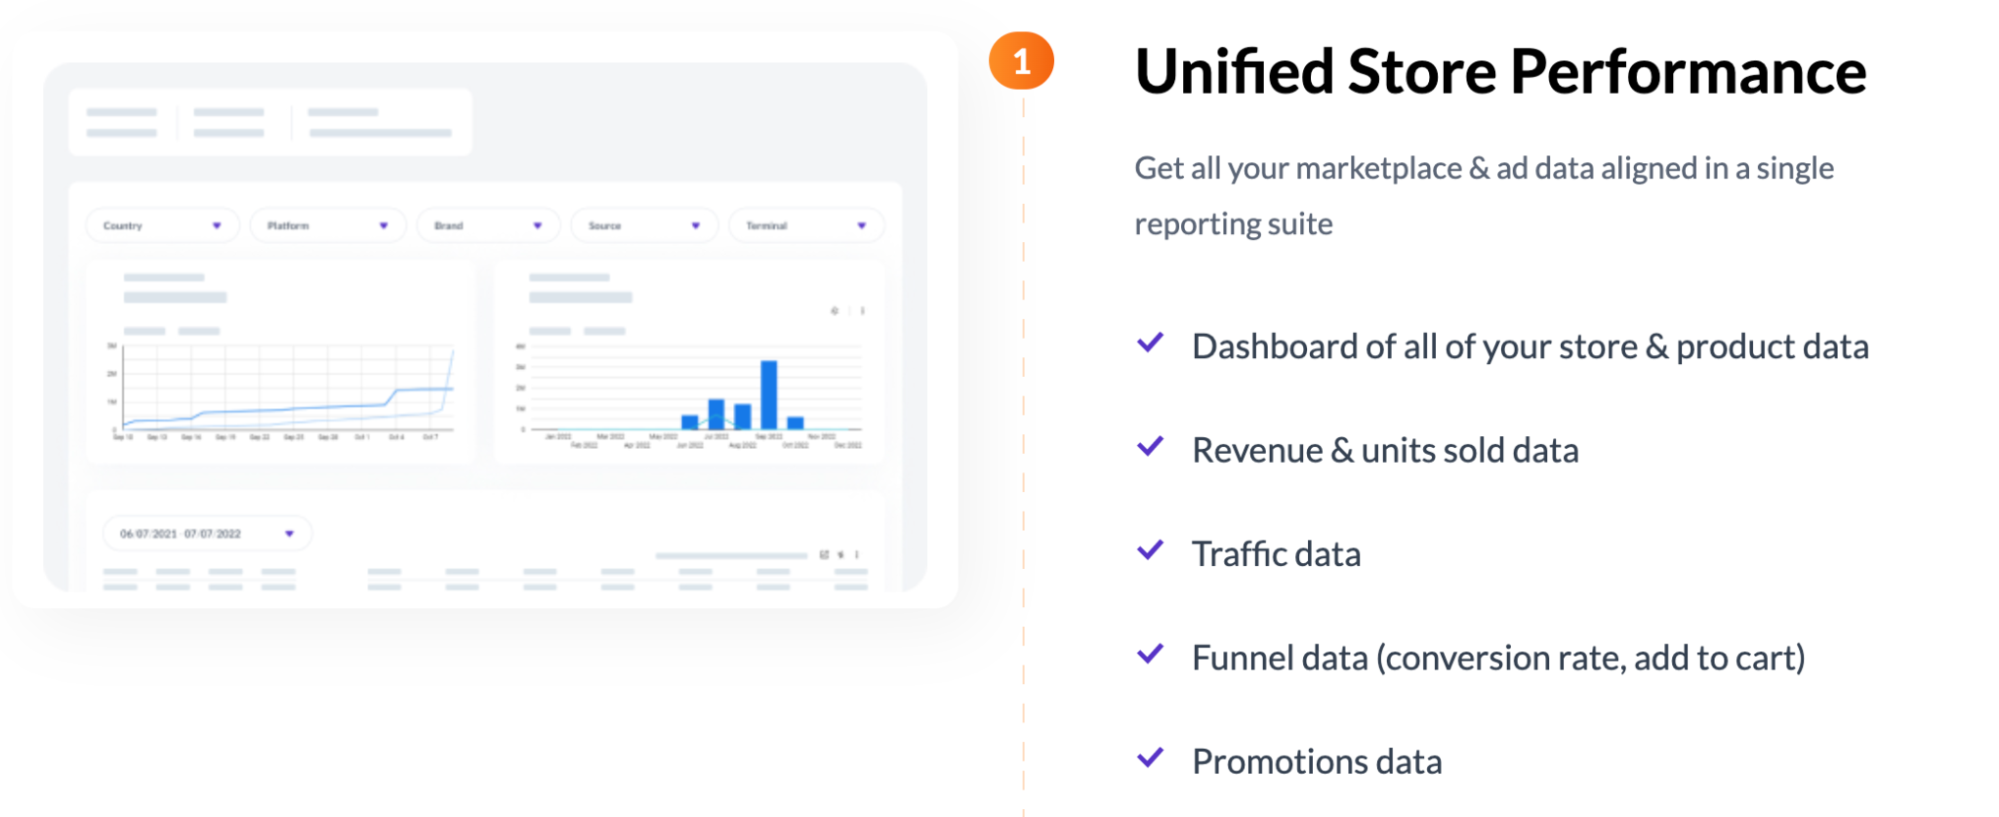
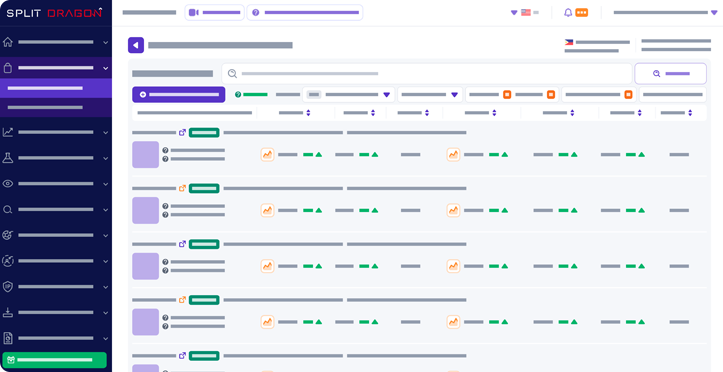
Screenshot from this source
To create the most effective e-commerce dashboard, you must first select the most important KPIs and indicators. Here are the top eCommerce key performance indicators your store’s performance dashboard should include:
Traffic sources
Maintaining track of where your traffic is coming from to ensure that it is coming from sources likely to convert visitors into customers. For instance, if you receive a lot of traffic from social media but only a few sales, you should focus on acquiring traffic from other sources.
Every online business needs traffic, but it can be difficult to determine which sources provide the most customers and revenue. Facebook, for instance, is an effective traffic source since it converts better than any other channel. It can attract more customers to your business.
But if the majority of your traffic or revenue comes from search engine results pages, it may be time to increase your SEO efforts.
Revenue and sales
This is the most obvious factor to monitor, and it is essential to monitor both overall sales and sales for each product type. This will reveal which products are selling well and where adjustments may be necessary.
You can utilize revenue statistics in several ways; your imagination is the only limitation. You can use your firm’s income as a snapshot of its performance over time, or you can split it down by the products it sells.
Conversion rate
This indicator tracks the number of visitors who perform a specific action, such as making a purchase, subscribing to a newsletter, or something else.
In an e-commerce dashboard, the conversion rate is one of the most vital metrics. It indicates how many of your website’s visitors became paying clients.
A high conversion rate indicates that your store’s visitors are becoming customers.
Average order value
The sum of the total revenue spent per order constitutes the “average order value.” It is calculated by dividing the total revenue from sales by the number of transactions. If the business wants to predict potential earnings, it needs to know how much money it earns on average from each customer. By analyzing the average order value, you may determine the effectiveness of your marketing and customer service.
If your average order value is high, customers are spending more on each transaction, which could indicate that your store is thriving.
By keeping track of these data sources, you may obtain a complete picture of your organization and discover methods to improve it.
Selecting the right eCommerce KPIs and indicators that best support your business objectives is crucial. If you do, you can avoid creating a dashboard that is overcrowded and difficult to comprehend. What will be included in your dashboard will be influenced by the type of dashboard you’re trying to create.
7 eCommerce dashboard metrics to check if your store is profitable
Real-world retailers have specific hours, whereas online stores do not. People want them to be available 24 hours a day, seven days a week. Your store’s dashboard contains a wealth of important data. It could inform you how well your firm is doing, where it needs improvement, and where potential difficulties may arise.
Even though it is essential to review all of your eCommerce dashboard data regularly, there are a handful that can help you identify issues more quickly.
- Number of visitors
- Recent order
- Number of potential prospects on site
- Number of orders by device
- Page load time
- Number of orders per hour
- Website response time
For instance, a dramatic decline in your conversion rate could indicate that your website or checkout process is faulty.
With these indicators, you can determine if orders are being processed efficiently and clients can complete their purchases. With this dashboard, you may immediately determine what is wrong with your website and make the necessary corrections.
Conversely, many “abandoned carts” may indicate that your clients have difficulty finishing their transactions. Keeping a close eye on vital dashboard data allows you to identify problems and take corrective action immediately.
3 eCommerce dashboard templates
1. Weekly or Monthly Store Performance Dashboards
eCommerce Dashboards can be configured to display data for particular periods (weekly, monthly, etc.). They are a basic method for tracking success and identifying areas for improvement.
Constantly monitoring your eCommerce business can help you succeed. It ensures that your organization is on pace to achieve its long-term objectives. Using a performance dashboard, you may compare your store’s performance this week to its performance last week or this month to its performance last month.
For instance, if you discover that sales decline on specific days of the week, you could modify the store’s operations on those days. Alternatively, if you observe a decline in consumer satisfaction, you can investigate the cause and make adjustments to enhance the purchasing experience.
Are your internet sales increasing? Is your customer acquisition cost decreasing? What do individuals purchase the most? Are your store’s quarterly objectives being met?
Regularly reviewing your shop’s performance dashboard can help you monitor your business and make data-driven decisions to boost retail success.
Weekly and monthly performance dashboards that display metrics regarding customer acquisition, sales performance, and orders will help you answer these questions and provide the data you need to make informed decisions regarding the future of your online store.
2. Marketing and Promotions Dashboards
Marketing is essential for businesses that wish to promote their products or services. But with so many channels and strategies available, it can take time to determine where to focus your efforts. In this situation, dashboard metrics can be really useful.
Visitors to e-commerce websites originate from numerous sources, including search engines, paid search, social media, and email marketing. A small change in the performance of these channels can have a significant impact on your bottom line. An eCommerce marketing dashboard containing metrics on the overall performance of marketing, marketing campaigns, and individual marketing channels can assist you in determining how to improve the efficacy of your marketing.
Tracking KPIs such as website traffic, social media interactions, and conversion rates can assist in determining which campaigns have the greatest impact.
3. Customer Support Dashboards
A customer support dashboard is a useful tool that allows businesses to track client interactions and gauge satisfaction. Companies that track their customers’ feelings can identify problem areas and resolve them.
A customer support dashboard provides a comprehensive view of your customer service and enables you to take the necessary steps to increase the efficiency of your customer service staff.
In addition, customer support dashboards typically include information such as wait times, average handle times, and first-call resolution rates. This data can be used to evaluate the performance of customer service agents and make necessary adjustments. Businesses can also learn more about how customers feel about their experiences by keeping track of sentiment data.
Set up your eCommerce dashboards
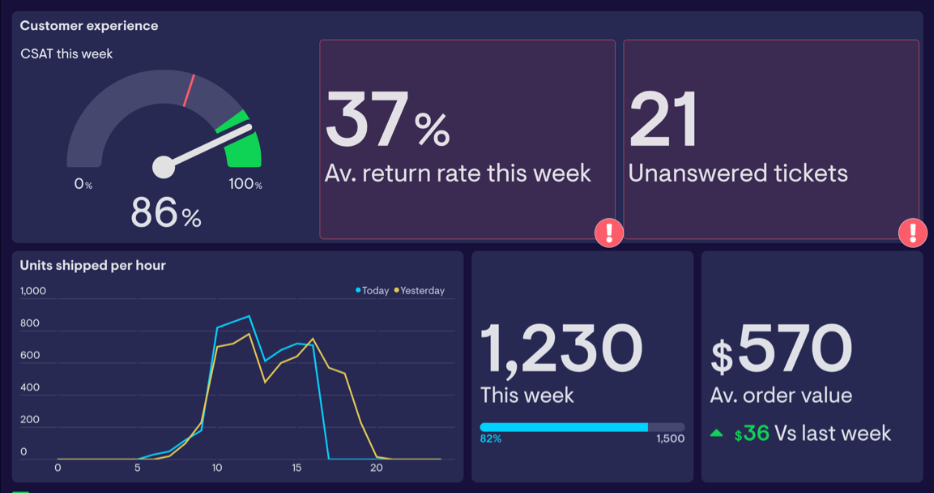
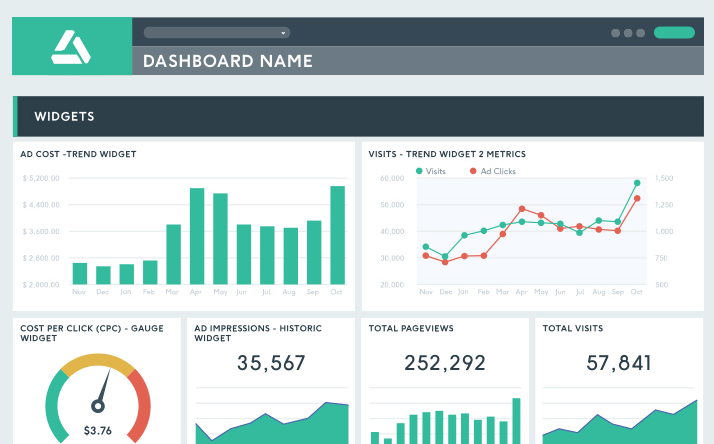
Screenshot from this source
It’s usually a good idea to create customized dashboard templates, enabling business owners, sales teams, and marketing specialists to examine crucial online sales indicators. If you know how to personalize these dashboards, you can obtain crucial sales data for your organization.
Concerning eCommerce businesses, there are too many factors to consider. Even if there were a single tool that could keep track of everything, it would not be easy to use. The best action in this situation would be to create an eCommerce dashboard for your organization.
You can use Insight360 by Split Dragon for your unified eCommerce dashboard needs.
We can help you brainstorm the perfect dashboard solution for your eCommerce business.
Let’s talk here and let’s see how to take your eCommerce business to new heights.